All fact sheets · The Strata Memo
Titanium
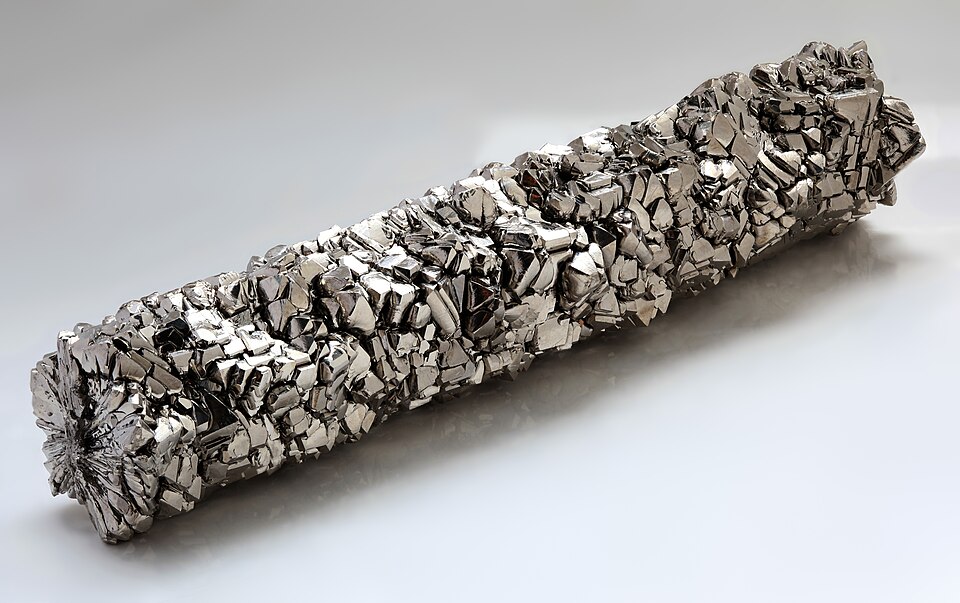

Hover, focus or tap to see the real thing
Photo Alchemist-hp ( pse-mendelejew.de ). “Titan-crystal bar.JPG.” CC BY-SA 3.0. Wikimedia Commons. File page
Chemical details
- State at room conditions
- Solid
- Melting point
- 1,941 K (1,668 °C)
- Boiling point
- 3,560 K (3,287 °C)
- Density
- 4.5 g/cm³
- Common oxidation states
- +4, +3, +2
- Electronegativity (Pauling)
- 1.54
- Atomic radius
- 187 pm
- First ionization energy
- 6.828 eV
- Discovered
- 1791
Source: U.S. National Library of Medicine, PubChem, Periodic Table of Elements (element Titanium) (current at retrieval)
USGS 2025 critical mineral. Figures: USGS Mineral Commodity Summaries 2026 (public domain); sources are in the source register.
Where it is made: six stages
bottleneck made in the U.S. partly no U.S. activity no source yet
Where the sites are
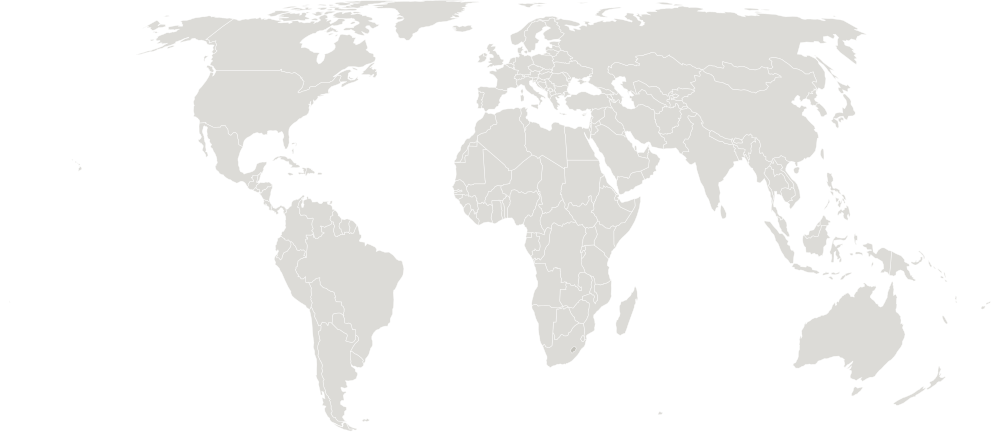
Refiningring = place only known to county or district
Most pins mark the centre of the place the source names for the site (a town, county or district), not the exact mine; U.S. sites from MSHA use MSHA's own coordinates for the mine. Hover for operator and outputs. Map outlines: Natural Earth (public domain); place lookup: © OpenStreetMap contributors (ODbL).
5 of 6 sites have no plottable place and are not pinned.
Overview
How much does the U.S. import?
of U.S. titanium use was met by imports in 2025 (USGS net import reliance).
Source: U.S. Geological Survey, Mineral Commodity Summaries 2026: Titanium Mineral Concentrates (February 2026)
Did you know?
William Gregor discovered titanium in Cornwall, England, in 1791; Martin Klaproth later rediscovered it and named it after the Titans of Greek mythology.
Checked against two independent sources. Verified 2026-10-26.
Sources: Wikipedia · Los Alamos National Laboratory periodic table (Wikipedia text is CC BY-SA)
How concentrated is supply?
68% of world production comes from three countries (China, Mozambique, South Africa). Highly concentrated.
Thirds of the bar: under 33%, 33 to 65%, 66% and over. Our own rule of thumb, not a USGS rating.
Source: U.S. Geological Survey, Mineral Commodity Summaries 2026: Titanium Mineral Concentrates (February 2026)
Supply
Who has it, and who digs it?
Where it is produced, 2025 (Mine production: Ilmenite)
| Name | Value |
|---|---|
| China | 34% |
| Mozambique | 20% |
| South Africa | 14% |
| Australia | 8% |
| Norway | 4% |
| Senegal | 4% |
Where the reserves are (Reserves: Ilmenite)
| Name | Value |
|---|---|
| Australia | 34% |
| China | 22% |
| Canada | 10% |
| Norway | 7% |
| Madagascar | 6% |
| South Africa | 6% |
Share of the world total as printed by USGS (rounded). Production and reserves are different things: reserves are what is economic to mine. Hover or focus a bar for its value, or switch to the table view.
Source: U.S. Geological Survey, Mineral Commodity Summaries 2026: Titanium Mineral Concentrates (February 2026)
Where U.S. imports come from
Choose a data set, then a view. A country keeps the same color in every chart on this page. Grey means other countries, or a country beyond the seven colors (always labeled). Hover or focus a mark for its value, or use the table view.
- South Africa26%
- Canada16%
- Madagascar16%
- Mozambique13%
- Other countries29%
| Country | Share of U.S. imports | Share of this chart |
|---|---|---|
| South Africa | 26% | 26.0% |
| Canada | 16% | 16.0% |
| Madagascar | 16% | 16.0% |
| Mozambique | 13% | 13.0% |
| Other countries | 29% | 29.0% |
Average share of U.S. imports of all forms, 2021–24, as printed by USGS (rounded, so shares may not sum to 100). Other countries are USGS's own grouping.
Source: U.S. Geological Survey, Mineral Commodity Summaries 2026: Titanium Mineral Concentrates (February 2026)
- Australia20% · $82.5M
- South Africa19% · $80.3M
- Madagascar18% · $72.9M
- Mozambique14% · $59.3M
- Canada10% · $43.2M
- Sierra Leone10% · $39.7M
- All other countries9% · $37.9M
| Country | U.S. imports, 2025 | Share of this chart |
|---|---|---|
| Australia | 20% · $82.5M | 19.8% |
| South Africa | 19% · $80.3M | 19.3% |
| Madagascar | 18% · $72.9M | 17.5% |
| Mozambique | 14% · $59.3M | 14.3% |
| Canada | 10% · $43.2M | 10.4% |
| Sierra Leone | 10% · $39.7M | 9.6% |
| All other countries | 9% · $37.9M | 9.1% |
U.S. general imports (customs value) in calendar 2025 under HS 2614; countries beyond the top six are grouped. The code can include goods beyond this mineral. The Shift view compares each country's share of 2025 with its share of Jan to Aug 2026 (shares of each period's total).
Source: U.S. Census Bureau, International Trade API: U.S. imports by HS code and country (calendar 2025; Jan to Aug 2026) (data months 2025-12, 2026-08)
- Japan34% · $392.5M
- United Kingdom8% · $97.9M
- China8% · $93.7M
- Kazakhstan7% · $79.5M
- France6% · $70.7M
- Canada6% · $69.8M
- All other countries31% · $357.4M
| Country | U.S. imports, 2025 | Share of this chart |
|---|---|---|
| Japan | 34% · $392.5M | 33.8% |
| United Kingdom | 8% · $97.9M | 8.4% |
| China | 8% · $93.7M | 8.1% |
| Kazakhstan | 7% · $79.5M | 6.8% |
| France | 6% · $70.7M | 6.1% |
| Canada | 6% · $69.8M | 6.0% |
| All other countries | 31% · $357.4M | 30.8% |
U.S. general imports (customs value) in calendar 2025 under HS 8108; countries beyond the top six are grouped. The code can include goods beyond this mineral. The Shift view compares each country's share of 2025 with its share of Jan to Aug 2026 (shares of each period's total).
Source: U.S. Census Bureau, International Trade API: U.S. imports by HS code and country (calendar 2025; Jan to Aug 2026) (data months 2025-12, 2026-08)
Price
Price, dollars per metric ton: Rutile, bulk, minimum 95% TiO2, free on board (f.o.b.) Australia
Source: U.S. Geological Survey, Mineral Commodity Summaries 2026: Titanium Mineral Concentrates (February 2026)
Trade and tariffs
Trade codes and tariffs
| HTS code | What it covers | Normal rate | Column 2 rate |
|---|---|---|---|
| 2614 | Titanium ores and concentrates | Free | Free to 30% |
| 8108 | Titanium and articles thereof, including waste and scrap | Free to 15% * | Free to 45% |
Rates from the U.S. Harmonized Tariff Schedule (USITC, saved 2026-10-26). The normal rate is column 1 general; column 2 applies to countries without normal trade relations. A range means different products under the code have different rates. An asterisk means the schedule footnotes point to Chapter 99 additional-duty headings. Section 232, Section 301, emergency tariffs and antidumping or countervailing duties are set in separate notices and are not shown. Look up any code at hts.usitc.gov. These are the main codes for this mineral, not a complete list.
Source: U.S. International Trade Commission, Harmonized Tariff Schedule of the United States, general and column 2 rates (edition current when saved)
U.S. trade by country
U.S. imports in 2025 by source country, code 8108
| Name | Value |
|---|---|
| Japan | 34% · $392.5M |
| United Kingdom | 8% · $97.9M |
| China | 8% · $93.7M |
| Kazakhstan | 7% · $79.5M |
| France | 6% · $70.7M |
| Canada | 6% · $69.8M |
U.S. exports in 2025 by destination, code 8108
| Name | Value |
|---|---|
| France | 17% · $431.2M |
| United Kingdom | 17% · $422.1M |
| Japan | 9% · $223.7M |
| Mexico | 8% · $207.9M |
| Canada | 6% · $151.9M |
| Germany | 6% · $141.9M |
2614 Titanium ores and concentrates
Top import sources Australia 20%, South Africa 19%, Madagascar 18%
Top export destinations China 36%, Malaysia 35%, Mexico 15%
8108 Titanium & articles thereof, includ waste & scrap
Top import sources Japan 34%, United Kingdom 8%, China 8%
Top export destinations France 17%, United Kingdom 17%, Japan 9%
U.S. Census Bureau International Trade API, saved 2026-10-26. Imports are general imports (customs value) and exports are total exports, in U.S. dollars. Duty collected is Census's calculated duty on imports for consumption. Figures cover every 10-digit product under the code, so they can include goods beyond this mineral, and the duty shown is not split into Section 232, Section 301 or antidumping duties. Bars show the largest code for each direction. Group rows such as the EU or OECD are left out so no country is counted twice.
Source: U.S. Census Bureau, International Trade API: U.S. imports and exports by HS code and country (calendar 2025, and January to Aug 2026) (data months 2025-12, 2026-08)
Value chain and risk
Value chain: where the bottlenecks are
Mining
In 2025 U.S. titanium mineral concentrates came from surface mines near Nahunta, Georgia and Starke, Florida, and a third company began commercial ilmenite production in Stony Creek, Virginia. (U.S. activity)
The source says
“In 2025, one company recovered ilmenite and rutile concentrates from its surface-mining operations near Nahunta, GA, and Starke, FL.”
“A third company began commercial production of ilmenite at a mine in Stony Creek, VA.”
Source: USGS Mineral Commodity Summaries 2026, Titanium Mineral Concentrates (PDF page 202) (2026-02)
Ore processing and primary recovery
The United States relies heavily on imported titanium mineral concentrates but is a net exporter of titanium dioxide pigment. (partly U.S.)
The source says
“Although heavily reliant on imports of titanium mineral concentrates, the United States was a net exporter of TiO2 pigments.”
Source: USGS Mineral Commodity Summaries 2026, Titanium and Titanium Dioxide (PDF page 200) (2026-02)
Refining and separation bottleneck
The United States made no titanium sponge metal in 2025 (the last plant closed in 2024), and sponge imports came 77% from Japan in 2021-24. (no U.S. activity)
The source says
“The United States did not produce titanium sponge metal in 2025. The last domestic sponge plant closed in 2024.”
“Sponge metal: Japan, 77%; Saudi Arabia, 13%; Kazakhstan, 8%; and other, 2%.”
“U.S. producers of titanium ingot and downstream products were reliant on imports of titanium sponge and scrap.”
Source: USGS Mineral Commodity Summaries 2026, Titanium and Titanium Dioxide (PDF page 200) (2026-02)
Metal, alloy and chemical
Four companies made titanium dioxide pigment at five U.S. facilities, and a Virginia company began making titanium powder from scrap in late 2024. (U.S. activity)
The source says
“titanium dioxide (TiO2) pigment production, by four companies operating five facilities in four States”
“a company in Virginia began commercial production of titanium powder from titanium scrap metal in late 2024.”
Source: USGS Mineral Commodity Summaries 2026, Titanium and Titanium Dioxide (PDF page 200) (2026-02)
Components and end use
Most titanium metal was used in aerospace applications. (U.S. role not stated)
The source says
“the majority of titanium metal was used in aerospace applications”
Source: USGS Mineral Commodity Summaries 2026, Titanium and Titanium Dioxide (PDF page 200) (2026-02)
Recycling
U.S. titanium scrap consumption data were withheld, and imports of titanium scrap were an estimated 32,000 tons in 2025. (U.S. role not stated)
The source says
“consumption data for titanium scrap metal for the titanium metal industry were withheld.”
“U.S. imports of titanium scrap were estimated to be 32,000 tons in 2025.”
Source: USGS Mineral Commodity Summaries 2026, Titanium and Titanium Dioxide (PDF page 200) (2026-02)
Bottleneck = one country dominates the stage, or the U.S. relies on imports for it, as the quote shows. “No sourced data yet” is not “no problem”.
Who operates it, where, and what comes out
4 operators, 6 named sites.
MiningOre processing and primary recoveryRefining and separation
Tronox
3 sites · South Africa
Sources
KZN Sands Fairbreeze mine
“The 1,036-acre (419 hectares) Fairbreeze mine in KwaZulu-Natal, on the east coast of South Africa, delivered its first load of titanium-rich ore in late 2015.”
“Fairbreeze produces high-quality ilmenite to feed the smelters at Tronox KZN Sands Central Processing Complex (CPC), as well as zircon, rutile, and other mining co-products.”
Source: Tronox, KZN Sands Fairbreeze Mine (company website) (2017-07-24)
Namakwa Sands mine and concentration plants (Brand-se-Baai)
“The open-pit mine and concentration plants are situated at Brand-se-Baai, 385km north of Cape Town.”
“Here the ore is mined and processed at the primary concentration plants to produce a mineral concentrate.”
“© 2026 Tronox Holdings Plc.”
Source: Tronox, Namakwa Sands, South Africa (company website) (2026)
Namakwa Sands smelter (Saldanha Bay)
“Rail trucks are used to transport the products 270km to the smelter at Saldanha Bay where the ilmenite is processed in furnaces to produce titanium dioxide slag and pig iron.”
“© 2026 Tronox Holdings Plc.”
Source: Tronox, Namakwa Sands, South Africa (company website) (2026)
Allegheny Technologies Inc.
1 site · United States
Sources
ATI Rowley titanium sponge plant
“Pittsburgh-based Allegheny Technologies Inc. is idling a titanium sponge production operation indefinitely”
“The titanium sponge plant in Rowley, UT, will be idled indefinitely”
Source: New Equipment Digest, ATI Idling Some Titanium Operations (2016-08-25)
Kenmare Resources PLC
1 site · Mozambique
Sources
Moma Titanium Minerals Mine
“Kenmare operates the Moma Titanium Minerals Mine, located on the north east coast of Mozambique.”
“Kenmare began production from Moma in 2007”
“The HMC is transported to the Mineral Separation Plant, where it is separated into four final products: ilmenite, zircon, rutile and Mineral Sands Concentrate.”
Source: Kenmare Resources, The Moma Mine (company website) (2026-10-30)
Titanium Metal Corporation
1 site · United States
Sources
TIMET Henderson titanium sponge plant
“The last remaining domestic titanium sponge plant is Titanium Metal Corporation’s (“TIMET”) facility in Henderson, NV.”
“TIMET’s Henderson, Nevada plant is the last active producer of titanium sponge in the United States.”
Source: TIMET, Section 232 petition executive summary (dated 2018-09-27; status is as of that date) (2018-09-27)
Not a complete register: a missing name means not yet sourced. Outputs are products named in the checked quote; the source page may list more.
Policy and funding
Policy timeline
Tagged by AI from federal sources; each links to the original. How we label.
Source: U.S. federal sources (Federal Register, Grants.gov, DOE, Regulations.gov, DFC), Policy items tagged for Titanium (dates per item)
Federal awards already made
The Chemours Co Fc LLC · Department of Defense · $4.5M obligated · started 2026-05-07
Source: usaspending.gov, retrieved 2026-10-29
The Chemours Co Fc LLC · Department of Defense · $4.1M obligated · started 2025-05-27
Source: usaspending.gov, retrieved 2026-10-29
6K Additive, Inc. · Department of Defense · $1.9M obligated · started 2025-04-10
Source: usaspending.gov, retrieved 2026-10-29
The 3 largest of 3 AI-tagged awards from USAspending (last 12 months, found by keyword; some are only loosely about this mineral). See all awards for Titanium.
Source: U.S. Department of the Treasury, Bureau of the Fiscal Service, USAspending.gov: spending by award (contracts and grants, last 12 months) (award start dates per item)
Data tables
Titanium Mineral Concentrates: USGS tables
United States
| Measure | Unit | 2024 | 2025 |
|---|---|---|---|
| Net import reliance as a percentage of apparent consumption | percent | 87 | 88 |
| Production | thousand metric tons | 100 | 100 |
| Imports for consumption | thousand metric tons | 658 | 730 |
| Exports, all forms | thousand metric tons | 5 | 10 |
| Consumption, apparent | thousand metric tons | 800 | 900 |
| Price, dollars per metric ton: Rutile, bulk, minimum 95% TiO2, free on board (f.o.b.) Australia | dollars per metric ton | 1,300 | 1,140 |
| Price, dollars per metric ton: Ilmenite and leucoxene, bulk, f.o.b. Australia | dollars per metric ton | 497 | 400 |
| Price, dollars per metric ton: Ilmenite, average unit value of imports | dollars per metric ton | 330 | 300 |
| Price, dollars per metric ton: Slag, 80%–95% TiO2, average unit value of imports | dollars per metric ton | 970 | 880 |
| Employment, mine and mill, number | number | 460 | 490 |
World production: Mine production: Ilmenite (thousand metric tons; top 6 of 11, plus other countries)
| Country | 2024 | 2025 |
|---|---|---|
| China | 3,040 | 3,200 |
| Mozambique | 1,930 | 1,900 |
| South Africa | 1,260 | 1,300 |
| Australia | 600 | 780 |
| Norway | 432 | 390 |
| Senegal | 345 | 370 |
| Other countries | 332 | 230 |
World production: Mine production: Rutile (thousand metric tons; top 6 of 8, plus other countries)
| Country | 2024 | 2025 |
|---|---|---|
| Australia | 200 | 200 |
| Sierra Leone | 80 | 110 |
| South Africa | 102 | 100 |
| India | 12 | 13 |
| Mozambique | 9 | 10 |
| Ukraine | 9 | 10 |
| Other countries | 10 | 9 |
World reserves: Reserves: Ilmenite (thousand metric tons; top 6 of 11, plus other countries)
| Country | 2025 |
|---|---|
| Australia | 170,000 |
| China | 110,000 |
| Canada | 50,000 |
| Norway | 37,000 |
| Madagascar | 30,000 |
| South Africa | 28,000 |
| Other countries | 46,000 |
World reserves: Reserves: Rutile (thousand metric tons; top 6 of 8, plus other countries)
| Country | 2025 |
|---|---|
| Australia | 35,000 |
| South Africa | 6,200 |
| Sierra Leone | 2,900 |
| Ukraine | 2,500 |
| Mozambique | 720 |
| India | 670 |
| Other countries | >540 |
U.S. import sources: All (percent of imports, 2021–24)
| Country | Share (%) |
|---|---|
| South Africa | 26 |
| Canada | 16 |
| Madagascar | 16 |
| Mozambique | 13 |
| Other countries | 29 |
Source: U.S. Geological Survey, Mineral Commodity Summaries 2026: Titanium Mineral Concentrates (February 2026)
Titanium Sponge Metal: USGS tables
World production: Titanium sponge metal production (metric tons; top 6 of 13, plus other countries)
| Country | 2024 | 2025 | Share |
|---|---|---|---|
| China | 256,000 | 260,000 | 70% |
| Japan | 57,000 | 53,000 | 14% |
| Russia | 33,000 | 25,000 | 7% |
| Kazakhstan | 19,000 | 16,000 | 4% |
| Saudi Arabia | 14,000 | 12,000 | 3% |
| India | 300 | 300 | 0% |
| Other countries | — | — |
World total 2025: 370,000 metric tons (as printed by USGS, rounded).
U.S. import sources: Titanium Sponge Metal (percent of imports, 2021–24)
| Country | Share (%) |
|---|---|
| Japan | 77 |
| Saudi Arabia | 13 |
| Kazakhstan | 8 |
| Other countries | 2 |
Note: Two MCS chapters: ore concentrates and sponge metal.
Source: U.S. Geological Survey, Mineral Commodity Summaries 2026: Titanium Sponge Metal (February 2026)